Hidden In The Low Frequencies
An exploration of the secrets hidden in the low-frequencies of high-frequency data - from radio to data encryption to video game world generation, and how this can affect real world decisions in a variety of fields.

Introduction
Hidden just below the surface of what you most clearly see, waiting for you just to squint your eyes, are many secrets you thought could never be found. This is the story of how the simple frequency tuning knobs on the radios invented over a hundred years ago hold the key to breaking encryption, deciphering the true intentions of humans, and so much more.
In this post, you’ll learn why you need to think about frequency domains when you’re developing software.
Hybrid Image Optical Illusions
Have you ever seen this classic optical illusion before? It shows what at first appears to be Albert Einstein, but if you squint or move far away from your monitor, you’ll see Marilyn Monroe appear:
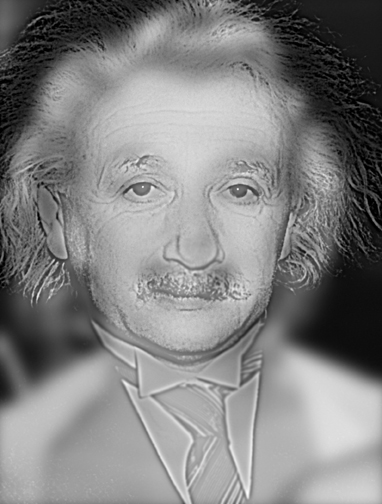
Image created by Aude Oliva in 2007, from images of Albert Einstein and Marilyn Monroe, published by New Scientist and MIT.
The way this works is simple:
- Albert Einstein is shown in the high frequencies, with clear sharp black lines forming his face, and any soft features made transparency.
- Marilyn Monroe is shown in the low frequencies, her face blurred heavily into grayish blobs, forming the broad color strokes in the background behind Einstein.
When you’re close to the image, you can clearly make out the sharp lines, and so your brain focuses in on those to identify the face it sees.
When you’re farther away or you squint your eyes, you can only see blurred images - so the thin sharp lines blur to almost nothing, meanwhile the already-blurred background shapes are barely changed by the added blurring, and so become the most prominent features of the image.
The main thing I want you to take away from this is: the high frequency details are clearly visible, and low frequency were not visible; but a simple blurring (squinting or moving away) reversed that, making the low frequency become visible and the high frequency fade away. The hidden was revealed with a simple action.
The Basics: Random Noise
Here’s the Frenetic LLC logo with 4 different amounts of RGB noise added: 0%, 50%, 100%, 300%:

Top left: 0%, top right: 50%, bottom left: 100%, bottom right: 300%. Code for the noising is listed at the bottom of this post. For the 300%, the filter was repeated 5 times.
This is noise at the highest frequency: every pixel has completely random coloration added to it, no extended waves at all. You would think 100% random noise applied on top of an image would completely remove it, right? Well… nope! There’s a few problems here, there’s a barriers problem and a centering problem:
- If you take a black pixel (brightness = 0%), and randomly shift it +/-100%… well it can’t go down, it can only go up, so you end up with 50% of your pixels still black.
- If you take a white pixel (brightness = 100%), and randomly shift it +/-100%… well, it can’t go up, it can only go down, so you end up with 50% of your pixels still white.
- If you take a green pixel (R=0%, G=100%, B=0%), same concept just spread between the 3 additive-primary colors.
- If you take a gray pixel (brightness = 50%), and randomly shift it +/- 100%… it can be anywhere from 0% to 100%, with equal odds.
- If you take a dark gray pixel (brightness = 25%), and randomly shift it +/- 100%… it will be often on the darker side, and sometimes brighter.
The following post is focused on images, so we have the hard limit of not going below 0% nor above 100% - that said, similar logic will apply without this constraint.
- For example, with unrestricted number ranges, 0% +/- 100% is a range from -100% to +100%, whereas 100% +/- 100% is a range from 0% to 200% - there’s a clear shift in the range of values possible at the end, even without that capping.
In the image above, the final option labeled as 300% was actually 100%, 3 times - so a black pixel shifted random to 50% black + 50% random colors, and then 25% black + 75% random colors, and finally 12.5% black + 87.5% random colors.
Here’s a close up of that 100% noise:

As you can see, for any given pixel, there’s a pretty random color. But for wide patches, you can see patterns clearly emerge.
Now here’s a close up of that 300% in the exact same area:

… wait, where’d it go? We could see it clearly enough still in the wide image, how’d it disappear in the close up?!
Similar story as with the hybrid image of Einstein and Monroe - the pattern is so faint now that you have to blur the high-frequency random noise a bit to see the pattern clearly. If you squint or step away from your monitor you can make out the tic still there.
If we repeated the noising behavior enough times, we can destroy this original image from view… not by removing the low frequencies, but by replacing them - with a middle gray. We’ll get into why this is significant in a bit.
The key thing I want you to note here: is large images retain their patterns longer than small close up images do. The reason is simple: the larger the image, the lower the low frequencies can go. Or, in other words, the wider the maximum wavelength is. Generally, lower frequencies or wider wavelengths are harder to hide.
Waves
Wavelengths… we’ve spoken thus far in terms of frequency, but to fully understand what we’re dealing with here, we need to consider wavelength.
Wavelength is defined as the inverse of frequency. That is, wavelength = 1.0 / frequency. This also works in reverse: frequency = 1.0 / wavelength. They are perfect opposites.
The Ocean’s Depth Is Not Particularly Variable

Ocean Waves, Matt Bango, StockSnap.io, CC0
When we think of waves, we often first think of ocean waves – water, lapping at the sides of a shoreline.
If you look closely at the surface of the water, you’ll see slight perturbations rippling out - perhaps a fish has darted, or a leaf has fallen, and the tiny effects are visible for but a moment. These have visibly tiny wavelengths (the distance between individual waves). Frequency is just speed over distance, and with such a tiny distance, frequency is consequently quite high.
When you zoom out, you see big waves, waves you can surf on. These have much larger wavelengths, and consequently much lower frequencies. Atop this big wave, the tiny ripples are still present - just harder to see when you’re looking at the full extent of the wave. (Especially when it’s moving really fast, but that’s beside the point.)
In short: When a drop hits the water, tens of ripples fly past in seconds. When you’re out surfing, you can count the seconds between the waves big enough to fit a person on.
When you zoom out farther, what waves do you see? Your answers here, depending on who you are, might range from “none?” to “tsunami!”. Neither is correct: What I’m looking for here is “tidal wave” (no, not tsunami, though the phrase has been misused to mean that at times). A tidal wave is a very wide, very shallow, wave created by tidal forces - the interactions of gravity between the Earth, the Sun, and the Moon. The is a type of ultrawide wave you only directly notice when for example it breaches over a barrier and the ocean begins flooding into a lowland.
As you can imagine, the wavelength of the tides is defined in terms of the radius of the Earth and how fast it spins. Or in other words: the wavelength is huge, and the frequency is so tiny that it’s not even useful to describe it per-second anymore, it’s clearer as per-day.
Key point: wavelength is the inverse of frequency, and their relationship is simple and intuitive. This is the reason why we see larger images retain more information through the noise than smaller images do - the wavelengths are wider, and the maximum frequency is lower.
Amplitude
Ocean waves are convenient, because the tiny waves are low-amplitude, and the big waves are large-amplitude. That is to say: the tiny ripples from a tiny drop never get so tall that they block your view of larger waves in the distance.
In terms of images, this is like film grain: there’s little noise all over an old video, but you can clearly see the video through it.
This is very much unlike our random noise example earlier, where we had 100% noise applied repeatedly - our wavelength was always exactly 1 pixel, and frequency can’t change if wavelength doesn’t, therefore: that 100% is the only variable remaining: amplitude, the scale of how much random color change happens. We used the maximum that image software lets us render, 100% amplitude, and simulated higher amplitudes by applying repeatedly.
Since our image wavelength is variable, and our noise wavelength is constant, it makes sense why we’d have to change a different variable (amplitude) to affect how well hidden the original image is within the noise.
Breaking The Noise
So we have hidden data with noise, and we know that how well it’s hidden is a factor of the size (wavelength) of the data we’re trying to hide - bigger source data, more noise is needed to hide it. Can we “break” that secrecy - un-hide the source data?
Merging Data
Let’s take that noised logo from earlier again - we did a 100% noise add, and repeated 3 times, and made the logo just barely visible anymore, nearly destroyed. And let’s simply recreate that “300% noise”, 5 times in a row, and then merge them evenly, and compare:

Left: a single 300% noise result, right: a merging of 5 unique 300% noisings
Note: by ‘merging’ I just mean adding together the values and subtracting by the count - so for example to merge 1, 2, 3 you calculate (1 + 2 + 3) / 3 = 2. This can be approximated easily in any image library by just drawing the layers together with opacity. The specific code used for this will be available at the bottom of the post.
Wait! That’s getting pretty visible again! I can make out the smaller details much more clear. The only limitation is it’s still very gray… but that’s easy, let’s go ahead and apply a brightness-contrast fix to it:
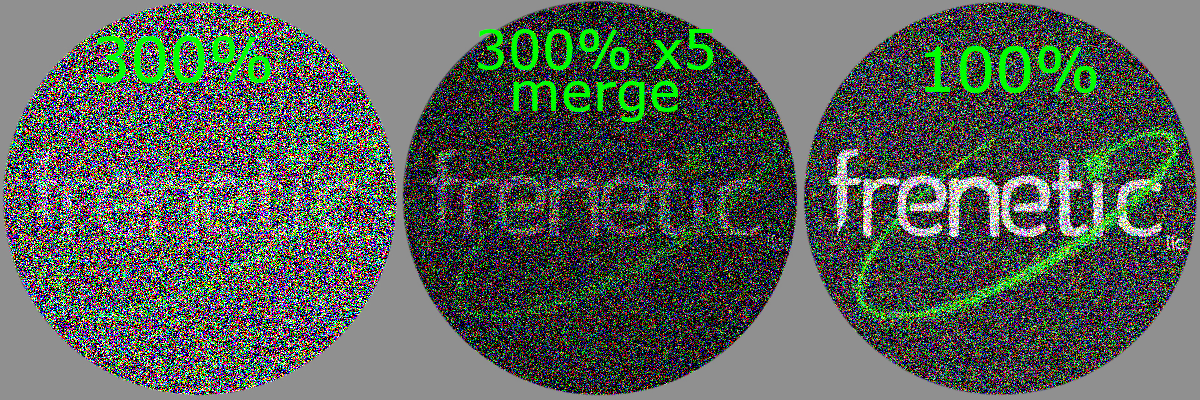
Left: the 300% noise result with a brightness-contrast adjustment, middle: the merged 5x with that same brightness-contrast adjustment, right: a 100% noise for comparison
The 300% noise result didn’t change much, it’s still a mess. But the 5x merge… it’s starting to look closer to a 100% noise rather than a 300% noise. We can very clearly see the original colors and details.
Each of our 300% noised images, as we determined earlier, has a 12.5% bias towards the original image’s contents. Therefore, the norm of the image is 12.5% shifted towards the original image. If that was all that was the case, the brightness-contrast fix would get it back to normal right away - but, of course, the image is hidden by the noise, and brightness-contrast fixes don’t do much to fix that. So how did we get that base image to reveal itself?
How could this happen? An aside on statistics
If you want to understand how this happened without considering frequencies, you just need to understand a few tricks of statistics:
When you mix numbers together, they tend towards the mathematical mean average - for example as shown above, the merging of 1, 2, 3 yielded 2, the middle value. When you mix RGB images, therefore, it tends toward middle gray. In general, the result tends towards 50%, whatever the middle value is, aka the norm.
when you mix random noise to other random noise, you get the exact same behavior: it tends towards the norm. What that norm actually is, is governed by statistics: if you mix two random numbers in the range [0.0, 1.0], it could be almost anything. But if you mix 10 random numbers in that range, it will probably wind up close to 0.5. In general, the more you mix, the more likely you’ll get the ‘true center’ of your range. The possible values at the end of mixing will be what’s called a normal distribution, also known as a bell curve.
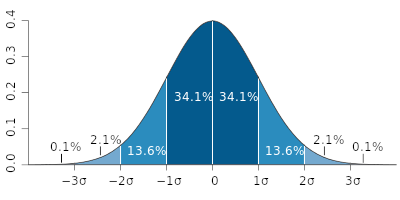
Bell Curve diagram, created by Ainali for wikipedia, CC-BY-SA 3.0
Understanding why Bell Curves form
For an intuitive understanding of why this happens, let’s think about coin flips:
One coin flip is one singular bit of random noise, and multiple coins flips together are the merging of several bits of random noise.
- flip a coin! What are the odds it’s heads? 50%.
- Now flip a coin twice, what are the odds at least one of two is heads? It’s more likely than if you only tried once, right?
- If you care for statistical math, we can convert this intuition to a calculation: the equation for “the probability of A, or the probability of B” together (inclusive of both as an option), is
p(A) + p(B) - (p A and B).- The possibility of both A and B is
p(A) * p(B), so0.5 * 0.5 = 0.25, 25%. - So the equation is
0.5 + 0.5 - 0.25 = 0.75 - Giving us a final answer that the chance of at least one of the two coins being heads of 75%.
- This also means the inverse, the chance of getting neither as heads, will be 25%.
- The possibility of both A and B is
- If you care for statistical math, we can convert this intuition to a calculation: the equation for “the probability of A, or the probability of B” together (inclusive of both as an option), is
- Now flip a coin 10 times, what are the odds of different results here?
- There are
2^10total possible arrangements, or1024. - There is only 1 way to have 0 heads and 10 tails: if you flip tails every time.
- There are 10 ways you can get 1 heads and 9 tails: the first is heads and other 9 are tails, or the second is heads and others are tails, or etc.
- There are 45 ways you can get 2 heads and 8 tails: the first and the second as heads, or the first and the third, or the second and the third, or etc.
- You calculate this as
9 + 8 + 7 + 5 + 4 + 3 + 2 + 1
- You calculate this as
- There are 120 ways you can get 3 heads and 7 tails: first second and third, or first second and fourth, or first third and fourth, or second third and fourth, or etc.
- This is like the above calculation but down a step and with an added layer:
8 + 7 + 6 + 5 + 4 + 3 + 2 + 1plus7 + 6 + 5 + 4 + 3 + 2 + 1plus (…) plus2 + 1plus1
- This is like the above calculation but down a step and with an added layer:
- 4 heads is 210, 5 heads is 252: the same logic as above, just add another step to it.
- 6-10 is the same in reverse, as it’s the same calculation just swap heads & tails around.
- So the probabilities are
1, 10, 45, 120, 210, 252, 210, 120, 45, 10, 1… you bet that there’s a bell curve!- The attached code at the bottom of this post contains a code snippet that proves this by generating every possible coin flip and outputting the count of options that have the given number of heads, and even renders a lil console graph of it.
- There are
So how does merging noisy images ‘bring back’ the hidden content?
- As noted earlier, the calculation of a ‘merge’/’mix’ here is
(a + b + c) / (count). - Each of our images is
(image + noise), so we’re adding( (image + noise1) + (image + noise2) + (image + noise3) + (image + noise4) + (image + noise5) ) / 5 - We can rearrange this math:
(image + image + image + image + image) / 5 + (noise1 + noise2 + noise3 + noise4 + noise5) / 5 - We know that
noiseis different every time, butimageis the same, so we can simplify down to:(image * 5) / 5 + (noise1 + noise2 + noise3 + noise4 + noise5) / 5 - And of course,
* 5 / 5cancels out, so it’s in factimage + (noise1 + noise2 + noise3 + noise4 + noise5) / 5 - So we just have image plus a simple mix of 5 noises, and we understand that mixed noises tend towards middle gray (0.5):
image + 0.5(ish) - So just subtract
0.5, and you getimage(ish).- Note that because we did some image processing earlier rather than working with actual numeric values, the exact math of the examples is tweaked a tad (scale-shift calculation) to compensate for image format constraints.
Also, as a bonus: here’s a merge of 50x copies to show that it improves as you increase the count.

Weren’t we talking about frequencies?
The above was a lot of math, I won’t blame you if you skipped past the section.
You can think of the merging of 5 copies of the image instead as stacking 5 layers of the 2D image into a vertical axis. Which is to say: we’ve simply made the image bigger, along a new axis. In other words: we’ve increased the wavelength of the base image, and we’ve seen directly that larger wavelengths are harder to hide in noise.
We can now connect these topics: the mathematical proof above that merging images reveals the underlying image, is the same reason why larger images are harder to hide - the more pixels you have, the more ‘coinflips’ you’re adding up.
Alright, so mathematicians would never screw up and have frequency data leaks in the real world, right?
Let me tell you the story of Stable Diffusion, the AI Image Generation software built by expert mathematicians, who accidentally* included a 100% noise algorithm that leaks low frequency data.
How Does Stable Diffusion Work?
The full details here are a story for another time, but let me just quickly address a key point: Stable Diffusion is an AI image generator implemented as a form of Latent Diffusion, wherein:
- “Diffusion” is a process by which an AI model is trained that:
- given:
- (1) an image with a percent of noise applied and
- (2) a text label indicating what the image is supposed to be
- predict a version of the image with a lower percent of noise.
- The idea here is that asking an AI to generate an image all at once is hard, but asking an AI to just remove some of the noise from an image is easy, so just have an AI “denoise” an image 50 times in a row, and then it can start from pure noise and iterate towards a real image by the end, and get a better result than if it tried to do it all at once.
- given:
- “Latent” means instead of working on RGB pixels, it works in compressed data space that represents an image in a more mathematically convenient way.
- (The reasoning for this is interesting, but outside the scope of this post)
So because of the “latent” part, “middle gray” is a bit off-color instead of true gray:
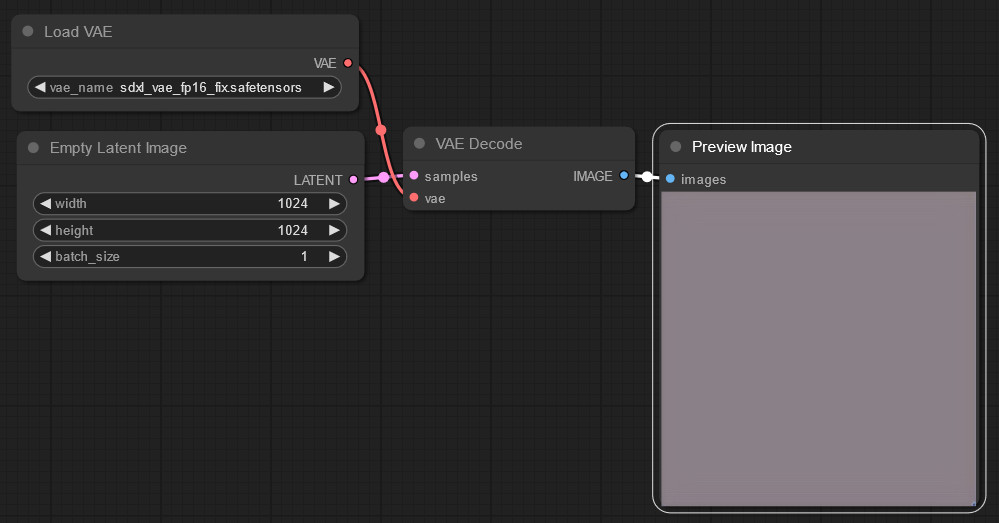
This is a ComfyUI Litegraph workflow view, used inside of SwarmUI. The “VAE” is the part that converts between “latent” images and normal RGB images.
That’s worth noting for if you dive into the area deeper, but won’t change our results here too much. Anyway, let’s ask the AI to generate a cat:
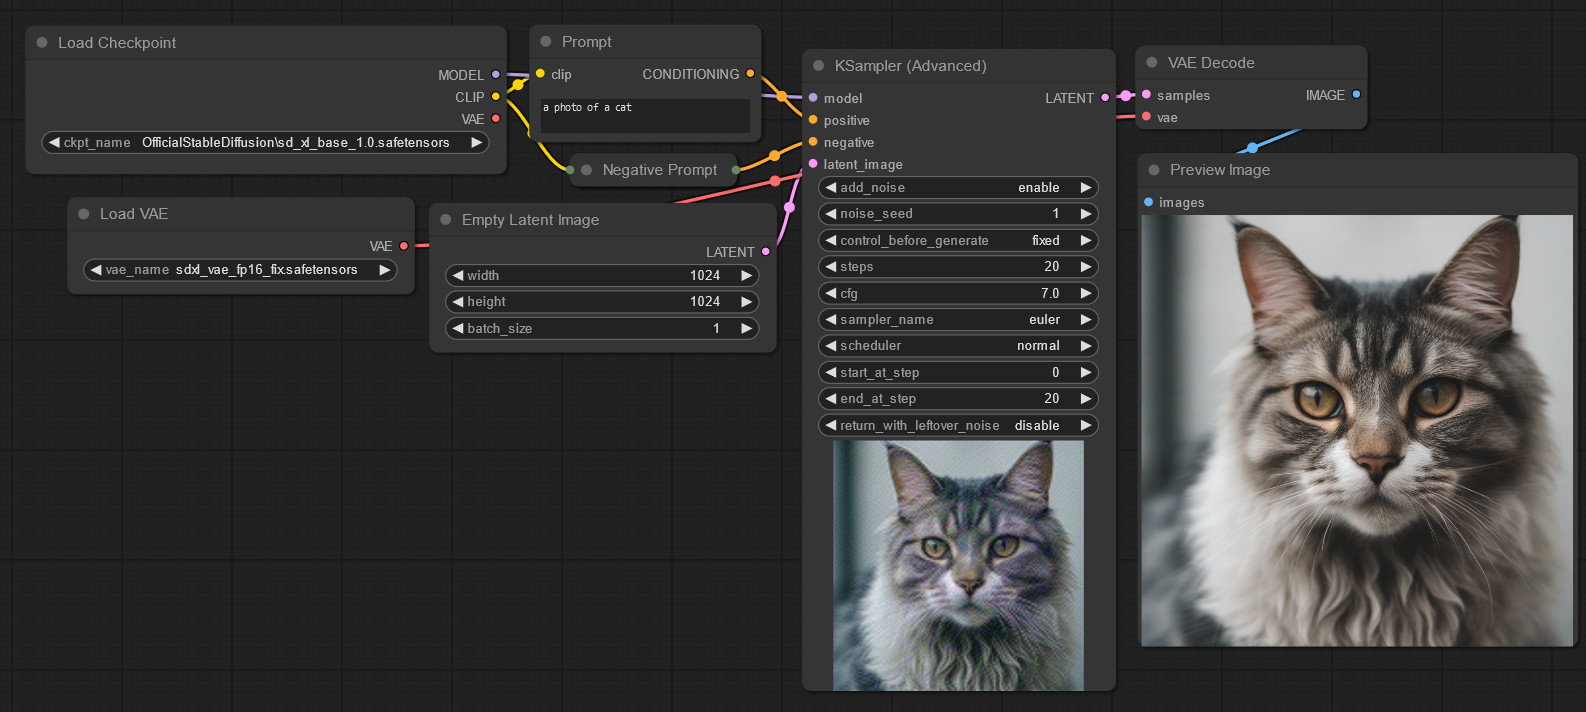
The cat on the right is the final output. The one in bottom-center is just a generation preview. The negative prompt is empty.
Cute kitty! Alright, so what’s the problem? We took a “middle gray” (in latent space) image, added 100% random latent noise, and generated a cat. It looks fine.
Artificial Oopsie Daisie
Let’s start from the color white and add the exact same 100% random latent noise and generate another cat:
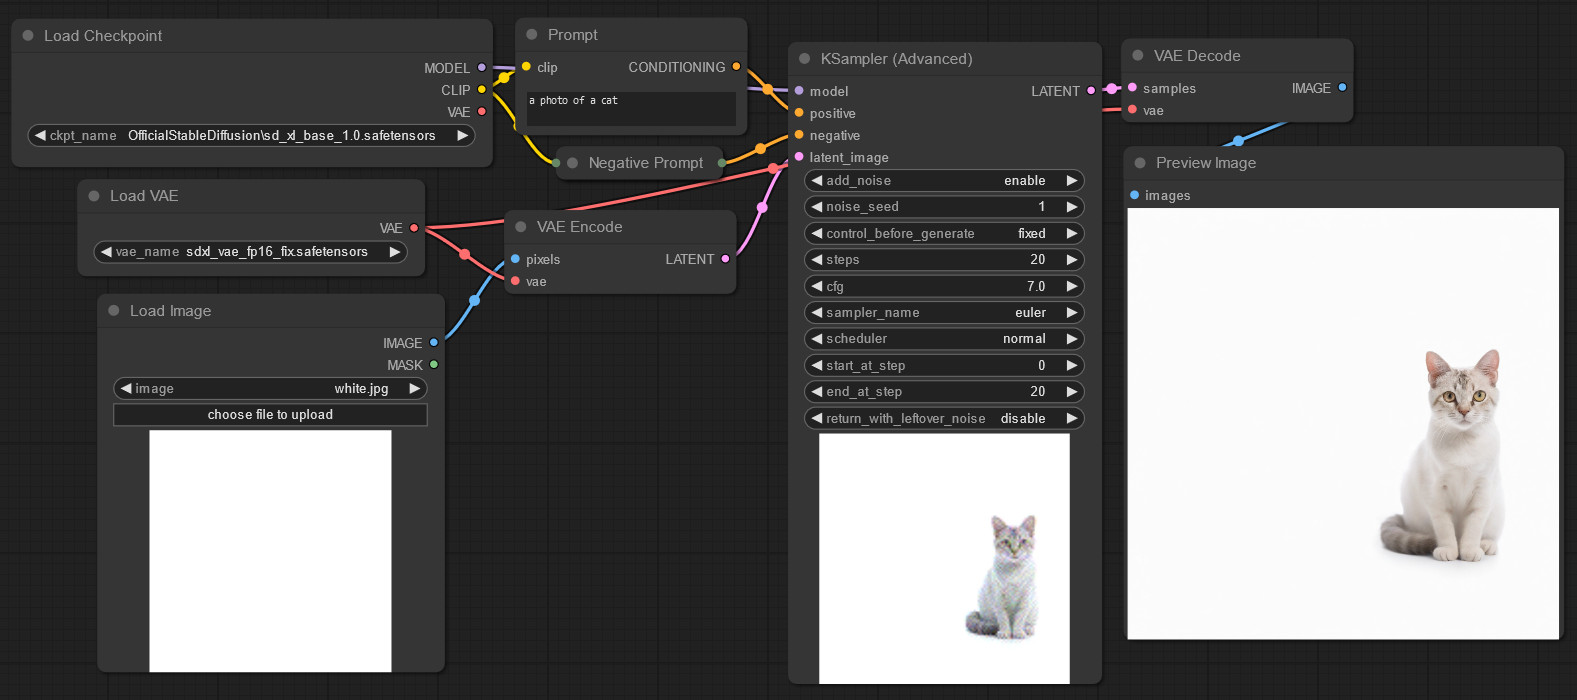
… Uh-oh.
Well let’s try black too to be safe:
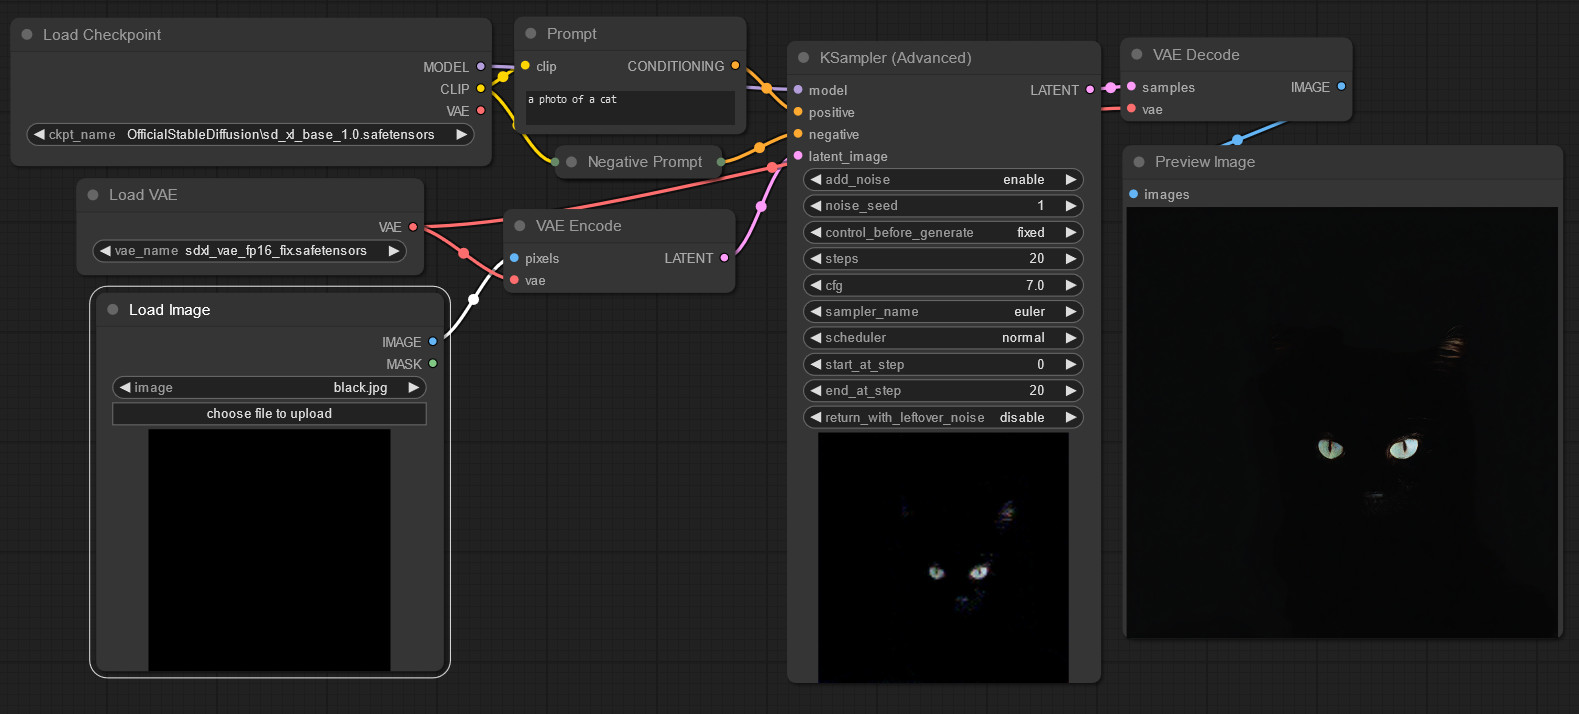
Welp. That sure looks like “100% noise” is preserving low frequencies there, doesn’t it?
But surely if you just use middle gray as intended it works, right?
Let’s compare the same AI image model against one that’s known to not have the same issue:
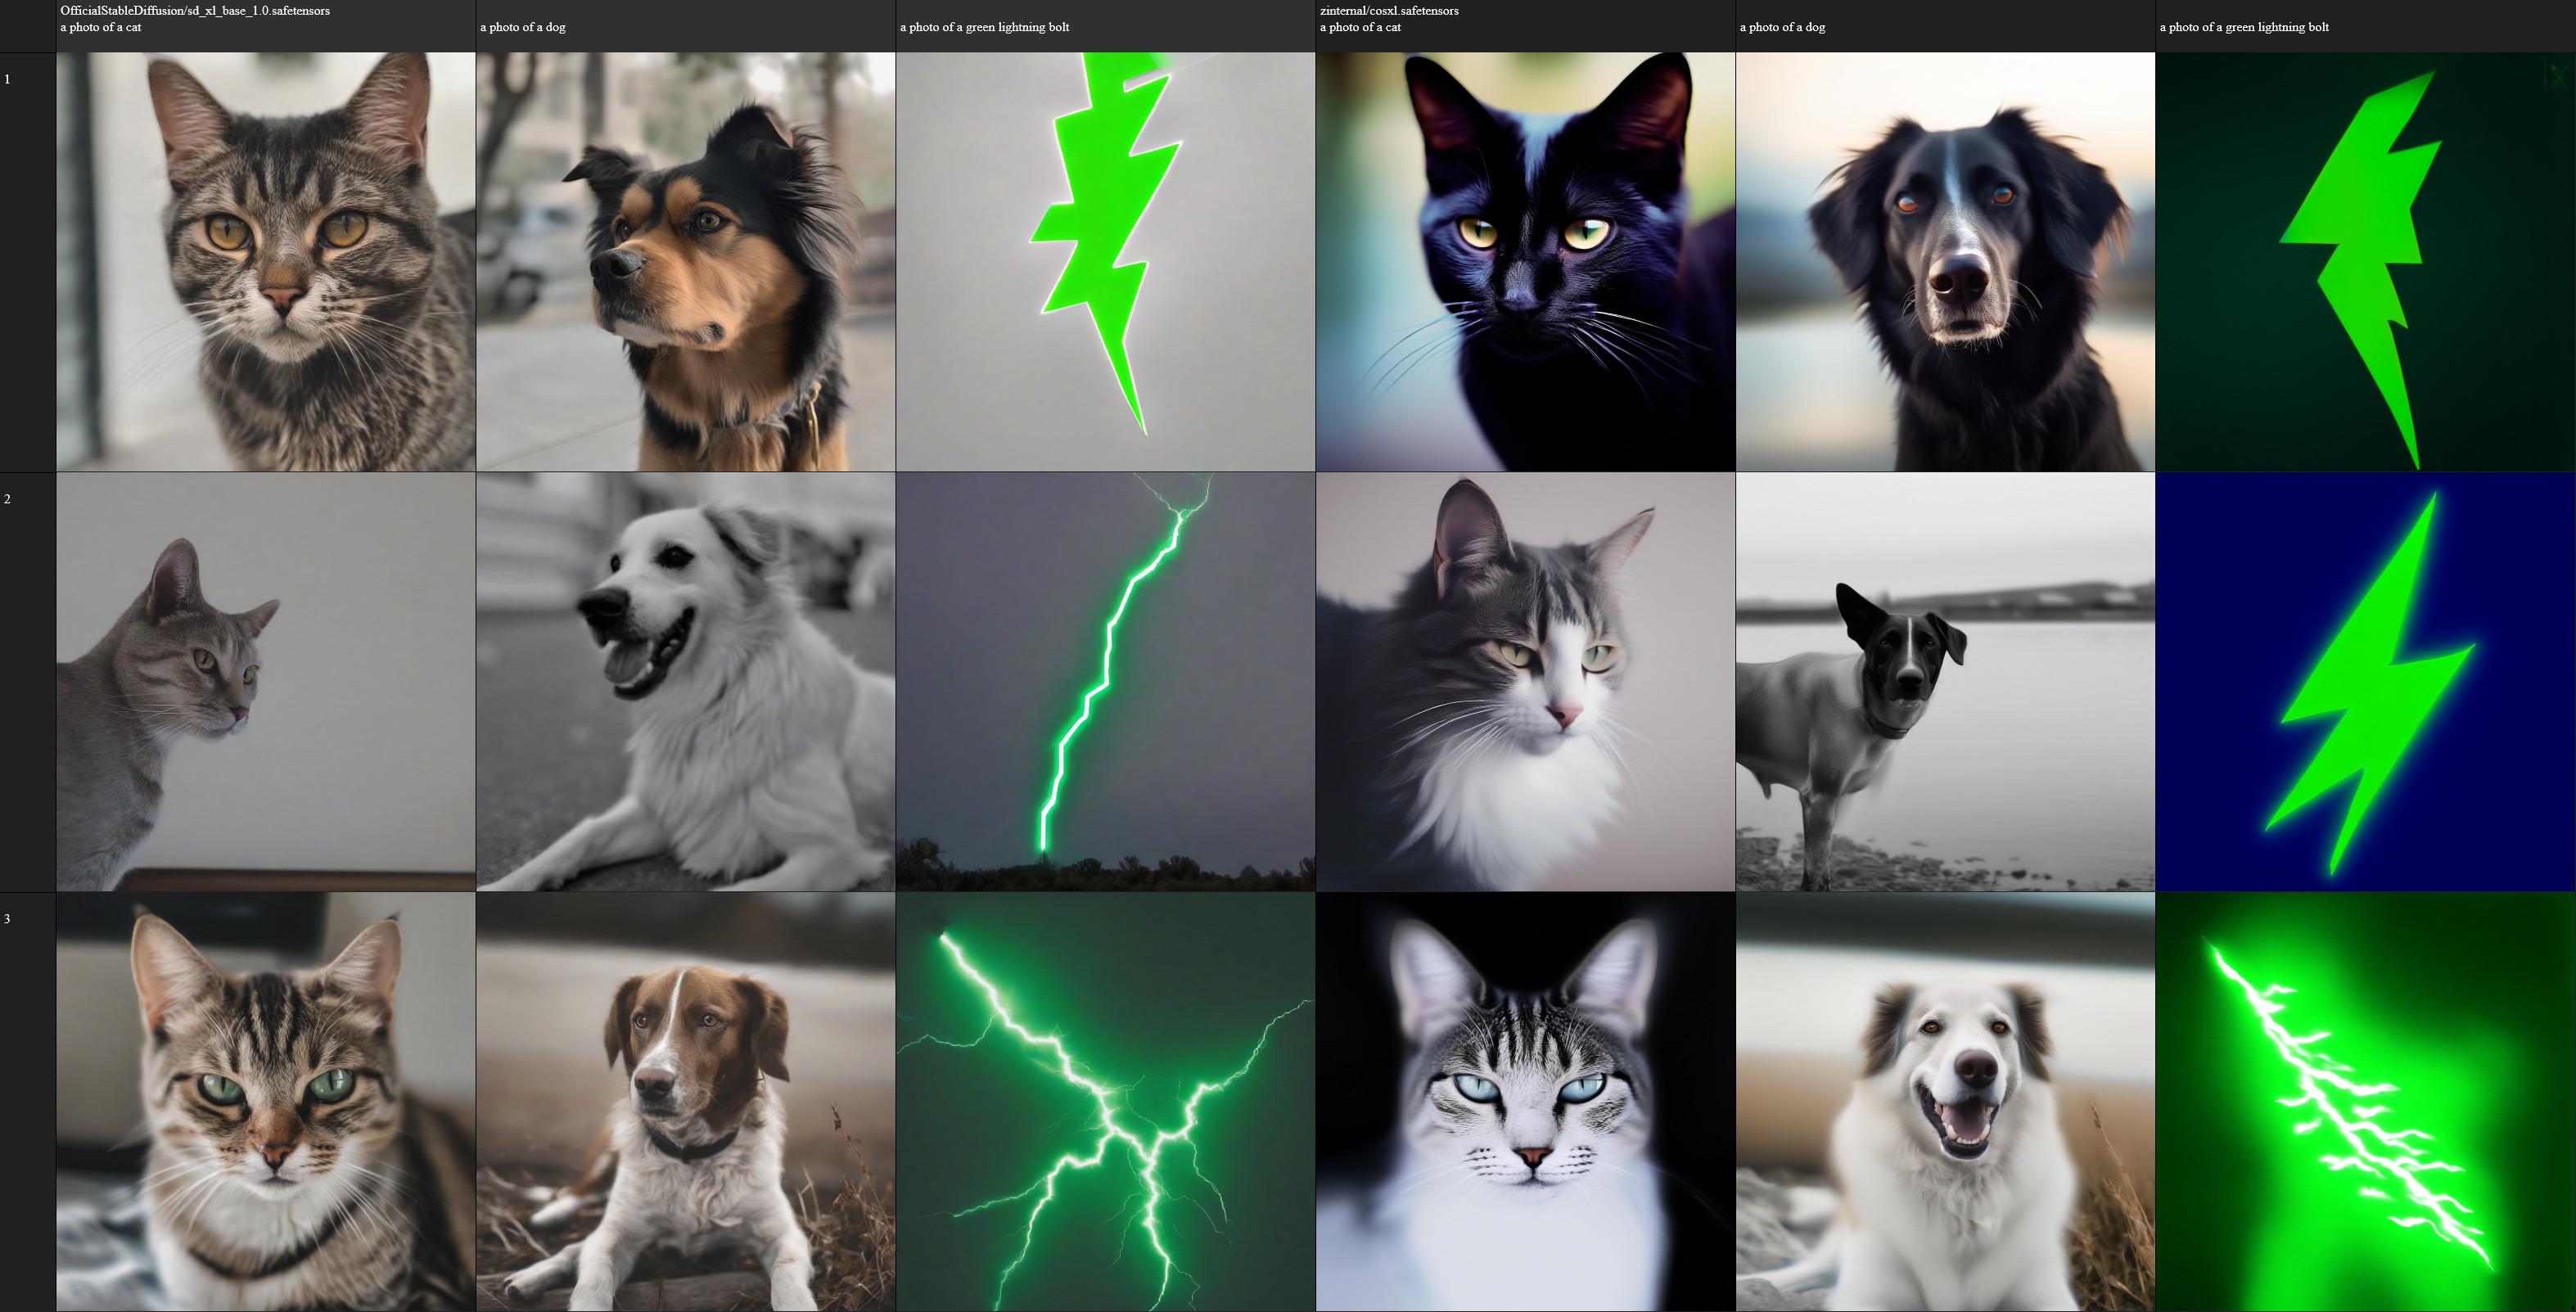
Left: images generated with Stable Diffusion XL 1.0, Right: images generated with CosXL. Both models created by Stability AI. CosXL was created specifically to publish a solution to this issue. Used as intended with latent “middle gray” inits. Grid generated using SwarmUI’s grid generator tool.
… Wow, you can actually see the “gray haze” covering the images on the left, especially on the lightning where you really want the visual pop of high saturation. That’s right: even running “exactly as intended”, early Stable Diffusion models (v1 and XL) produced a gray haze over all images due to improperly handling low frequencies.
How did this happen, and how did they fix it?
Well the first reason it happened is because I hadn’t written this post yet so they couldn’t have read it and realized that image + (noise * scale) is wrong, you need (image * (1.0 - scale)) + (noise * scale), so they just did image + (noise * scale) and broke it*. The other reason is for the initial AI training algorithms used, having “true pure noise” on the 100% step broke the AI model - it was a denoising model, it couldn’t figure out how to create something from truly nothing. So instead it learned how to “extract an image from a noise”, and just was run with noise so dense that it had to make up an image along the way.
* I did not discover this problem, it’s well documented long before this post, and the relevant AI researchers probably knew better and just accepted it as a side effect of what was needed to make the model work. The math is also way oversimplified here vs. the real implementation, I know, shush, don’t @ me.
The way they fixed it - well, the math gets too complicated for this blog post, but, essentially, fix some things in the AI-specific logic, and then boost the signal-to-noise ratio trained against to something more like 0.00000001 (sometimes referred to as “zSNR” among AI researchers, for “zero signal-to-noise”) such that much much much lower frequencies are needed to escape into output images, lower frequencies than can be created within the image resolution used by the model.
Encryption
We’ve discussed quite a bit about information hiding and how to pull it back out – but we haven’t yet discussed the formal field of study around hiding information, cryptography. Let’s do some encryption!
Demo
To start with, as a simple demo, let’s take a line of text and encrypt it using AES-256, one of the best modern standards for digital data encryption.
Here’s our text:
1
This is some example text, written with common characters in English, and encoded as ASCII bytes.
And here it is encrypted:
1
#????i??34?Tz?c???2?f?????|{???E?eM??O??????I#&????5??J?h?????<??????x??D2F??AMZ?????@??????d45?????^????P????_a
Note here that the encrypted data is binary, and being read back in ASCII encoding, so each ? actually represents a character that doesn’t fit in the ASCII range.
Beautiful! Text encrypted flawlessly, I can’t read that - can you? Only the generated binary key can pull it out.
Okay, but we’ve been working with images this whole time, so let’s take that Frenetic logo and encrypt it using this powerful modern encryption standard.
![]()
… Uh… uh-oh.
So What Happened?
Well, in short: … frequencies, amirite?
In long: this is a well known issue with block-level encryption: AES encrypts individual ‘blocks’, wherein a ‘block’ is a static section of a predefined number of bytes at a time. This means while the data within a block is indecipherable, if you have many blocks, you can work out a ‘low frequency pattern’ by comparing different blocks. In the case of the image, the background blocks of pixels are all identical, the black circle blocks are identical, and because the blocksize is relatively small, even the text has identical sub-sections.
That image was generated using AES in ‘ECB’ mode (“Electronic CodeBook”), meaning it encrypts each block independently. ECB is not recommend in cryptography due to this block patterning issue.
Let’s try instead in ‘CBC’ mode (“Cipher Block Chaining”). CBC is an improvement that has each block modified by the previous block (direct block-xor) to prevent patterns from emerging.
![]()
Much better!
As a bonus, here’s the earlier text re-encrypted with CBC
1
P??{-???????V?3I?Dw????lC"0?v? ?|??y*???H?p????d??HzE?=???O;wq??`pT???hT?????????-???????}Gb??p_???v???}c18?xb?I
Alright, we know your tricks - go merge a bunch and break it
Okay if you insist, here’s 100x AES-256 CBC encrypted copies of the Frenetic logo stacked together, all with the same key but unique initialization vectors:

… What, did you think that would work? I said AES is the one of the best modern standards for encryption, it protects everything from your personal web traffic to the US Military’s secret communications. How scary would it be if it could break that easily?! AES-CBC isn’t even necessarily the best sub-standard for ensuring AES encryption is hard to crack, but it’s enough to defeat any tricks that could fit into a post like this.
Advanced modern digital cryptography is built by as a joint effort of the world’s greatest mathematicians and programmers, hackers and governments, so they worked hard to make sure there’s no holes. We did discuss above though that even experts make mistakes, though, so: if you can find ways to break AES-256 with a proper block mode, you can earn massive amounts of money on bug-bounty programs (a ‘bug bounty program’ is a system where the companies that develop important software will pay you money if you report dangerous bugs to them, as a way to reward ‘white hat hackers’ and discourage them from giving those dangerous secrets to criminals that would abuse them).
Frequency-related trickery like what’s discussed here is certainly a prime tool to use for breaking encryption, and has broken so many historical ciphers - basically every form of encryption that predates modern computers can be broken by frequency analysis. For example, the “Caesar Cipher” (so named for its claimed historical usage by Julius Caesar), is a simple cipher that one can do by hand by simply shifting letters over by a fixed number. This is easily broken by frequency analysis (or just by trying all 26 possible shifts until you find the answer).
Breaking a Substitution Cipher
A “Substition Cipher” (wherein you map certain letters to certain other letters, usually in a less predictable way than just shifting the alphabet) cannot be broken by just trying all the keys as there are too many possibilities. But frequency analysis comes in handy: in English, the letter e is most common, so simply find whatever letter’s most common, and assume that’s e. Or, find three-letter words that appear often at the start of a sentence and before longer words, and assume that’s probably the, and now you’ve mapped 3 letters. Any free-standing letters are obviously I or a. A few tricks like this later and you’ll have enough decoded that you’ll be able to figure out the rest.
Just in case I haven’t hammered home the key point here enough yet: If I give you a small bit of high frequency data, such as the ciphertext Gsv without the key… good luck decoding what I mean. It could be anything. But what if I give you a big chunk of data that gives you enough room to analyze the frequencies:
1
2
3
4
5
Gsv yolt klhg R'n dirgrmt hfiv rh tvggrmt ivzoob olmt,
R'n kilyzyob tlrmt gl szev gl xfg luu hlnv lu dszg R kozmmvw gl yv rm z hvkzizgv ufgfiv klhg.
Yfg gszg'h gsv rmvergzyov ivhfog lu szermt nliv kzhhrlm gszm ulxfh, svs.
R slkv blf vmqlbvw gsv klhg.
Szev blf qlrmvw gsv Uivmvgrx OOX Wrhxliw ygd? Blf hslfow.
Now that the range is pretty wide… you can apply the tricks I gave above, and think logically about what else is hinted at, and you’ll be able to decode the secret message pretty quick, and discover how lazy I was at choosing a substitution key. (Yes I’m leaving this as an exercise to the reader and not providing the answer here.)
Video Game World Generation
Alright, back to frequencies. Here’s a fun example of somewhere else noise frequencies can be found: forming the foundation of procedural world generation in video games.
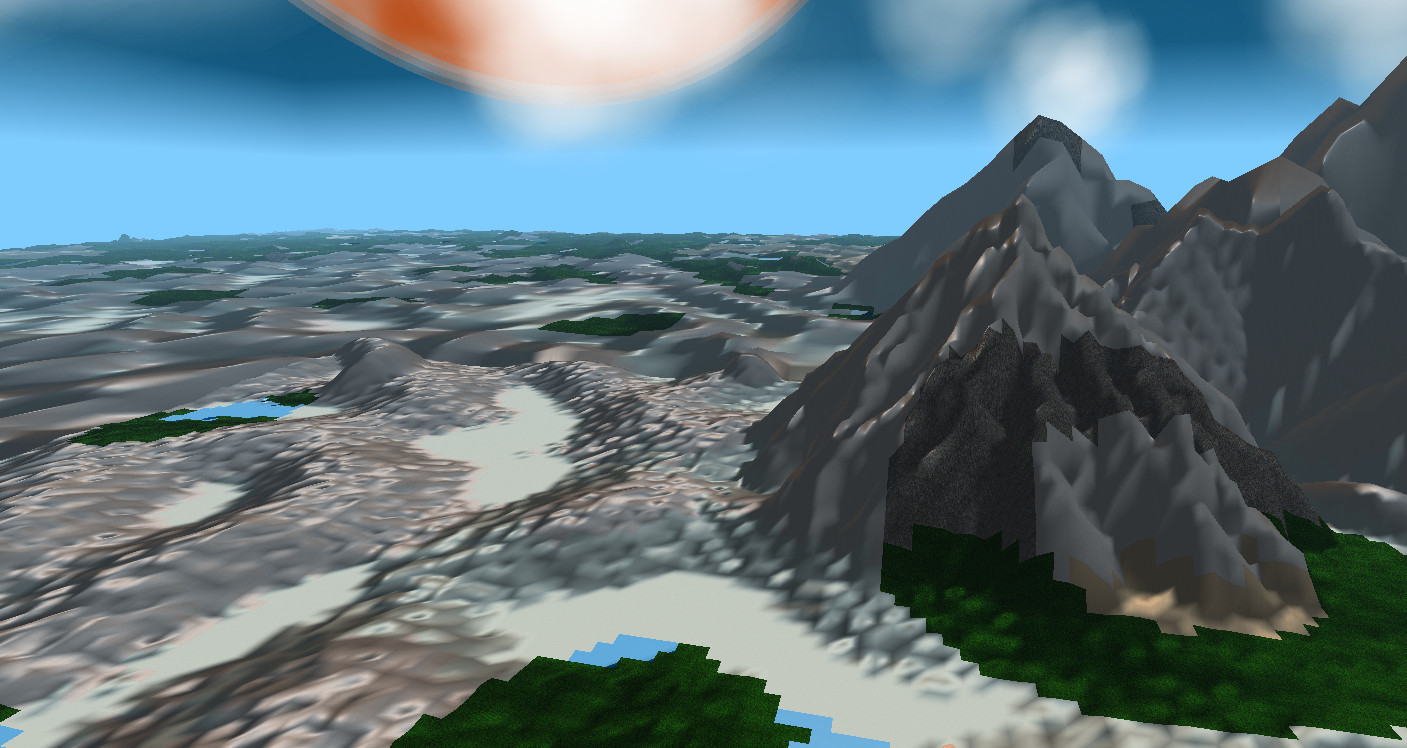
Voxalia Pre-Alpha
The above is a screenshot of the world from a Pre-Alpha version of Voxalia, the game we’re building here at Frenetic LLC. The terrain consists of layers of randomly generated noise stacked together at varying wavelengths and amplitudes, and then special algorithms that generate shapes like mountains and stack them on top.
You can easily make out the mountains of course, but if you look closer you can see there’s large rolling “hills”, and closer still there are small variations in local terrain height all over here, more noticeable in some biomes than others.
This isn’t a huge sub-topic to explore like breaking encryption, but if you’re a programmer, this is a prime example of somewhere you might apply an understanding of how different-frequency data stacks.
But teacher, I’m not a mathematician, when will I ever apply this in my real life?
You’re not in a classroom, and how did you even get this far down the post if you weren’t interested? And why are you writing titles for me? Am I losing my mind because I accidentally split the writing of this post up over weeks and made it way longer than initially intended? These questions don’t matter, let’s focus on noise and frequencies.
The topic of frequencies and noise are extremely important to human psychology and interpersonal communication! You use your personal understanding of these topics in real life every day, whether you’ve realized it or not. Perhaps after having read this blog post, you’ll think about the communication around you in a different light, and maybe even improve your own communication!
Consider: have you ever had a long time friend do something wildly out of place, maybe something hurtful to you, but you forgave them and moved on because it was just a one-off event, they were a long time friend, they’re usually not like that? Well guess what: you just saw past a high frequency detail but made decisions according to the low-frequency data you know to be more significant.
Have you ever had someone driving down the street cut you off or some other one-off event, and decided “that guy’s an asshole”? You only got the one bit of data, a very zoomed in view, so you could only see the high-frequency and couldn’t make out the low frequency data that would’ve been there if you zoomed out.
Frequencies are everywhere. To master frequency analysis is to better understand life around us.
We can apply this understanding throughout the human experience. The phrase “actions speak louder than words” might as well just be “low frequency behaviors are more visible over time than high-frequency behavioral spikes of speech” (warning: if you say this phrase in conversation you might encounter the behavioral spike of getting punched in the face because who the hell talks like that). As people get older, they grow wiser to the world but find it more difficult to learn new things - in other words, as you grow older, data that’s low frequency in life (over time) becomes more clear, and high-frequency details become more easily overlooked.
This is a perfect time as well to bring up an example of where this applies is non-technical professions. “Noise” in marketing is defined in terms of mental distractions - anything that causes your audience’s attention to move away from the point. If you’re trying to sell a product on the streets, this could be the literal auditory noise of cars and people in the background. In the modern cyberpunk world we live in, the biggest noise distracting attention away from your advertisements is all the other advertisements right next to the first advertisement.
This is a specific definition, but it’s the same “noise” we’ve been discussing this whole time. It has the same properties, such as signal-to-noise ratio, and of course: frequency.
In marketing, frequency analysis is often exploited: just as we’ve discussed how low frequencies shine through when high frequencies are ignored, the same is true in the context of advertisements. If you see the same ad for a fast food joint day after day, always in the background - you might ignore it, but over time it leaches in. Marketing experts know this, and that is why redundant advertisements are so often repeated: their audience might ignore the high frequency spikes, but with enough repetition they enter the not-so-ignorable low frequency range, and enter your head. This is why they say “any publicity is good publicity”: the more their name is out there, the more they become part of the low-frequency background and the more they enter your head. How many “triple-A game studios” have you heard nothing but bad press about, and yet everyone keeps buying their games? “Well it’s the new Crappysoft game, it can’t be that bad!” when there’s much higher reviewed indie games right there… that you’ve never heard of, and why would you buy a game from a company you’ve never heard of?
But teacher, I AM a mathematician, why haven’t you mentioned Fourier Transforms yet?
Ah, you mean the most important mathematical function underpinning any good discussion of frequency analysis? The thing that is strongly tied to the core concept I teased in the intro about radio tuning? Well, you see, the reason I haven’t mentioned it yet, is, er…
(The author of this post is seen quickly hiding a calendar showing that this post was meant to come out in May, despite it currently being late June.)
Because I very definitely planned from the start for that to be a part two!
The topic of Fourier Transforms, sine wave decomposition, spectrograms, electromagnetic signal (eg radio) frequencies, audio frequencies, and everything that comes with those, is quite a large and interesting discussion of its own worthy of its own big followup post.
Conclusion
In this post you’ve learned some of the basics of frequency analysis, some of the math inside of it, and the real world effects ranging from hiding images in noise and pulling them back out, to breaking simple encryption, to even applications to understanding human behavior.
Naturally, frequency analysis is just one perspective to figure things out with. Many of these applications can also be thought of from different perspectives as well, such as the probabilistic/statistical method mentioned earlier. I don’t intend to completely change your perspective on anything, but rather I hope I’ve expanded your perspective - given you new ways to look at and understand the world around you. Frequency analysis is just one tool in the toolbox of the highly perceptive person.
In the next post on this topic, we will dive into more advanced techniques relating to frequencies.
For now, I will leave you with a question to ponder: As we discussed above, human behavior contains information across multiple frequencies. What secrets do you yourself or those around you hold tight, that would never be revealed upon direct questioning, but are made quite clear from simply watching long-term behavior? Perhaps you have friends who always talk like they don’t care, but when push comes to shove always have your back. Perhaps the opposite, someone close that talks like they love you, but their patterns of behavior don’t quite match. Or perhaps you hold a deeper secret, you haven’t yet realized is on display for all the world to see?
Appendix A: Related Sample Code
Here’s C# code to play with / demo a few of the concepts displayed above.
First, a csproj header if you need it - only dependency is ImageSharp for the image processing bits
1
2
3
4
5
6
7
8
9
<Project Sdk="Microsoft.NET.Sdk">
	<PropertyGroup>
		<OutputType>Exe</OutputType>
		<TargetFramework>net8.0-windows</TargetFramework>
	</PropertyGroup>
	<ItemGroup>
	  <PackageReference Include="SixLabors.ImageSharp" Version="3.1.4" />
	</ItemGroup>
</Project>
And here’s the actual relevant source code:
1
2
3
4
5
6
7
8
9
10
11
12
13
14
15
16
17
18
19
20
21
22
23
24
25
26
27
28
29
30
31
32
33
34
35
36
37
38
39
40
41
42
43
44
45
46
47
48
49
50
51
52
53
54
55
56
57
58
59
60
61
62
63
64
65
66
67
68
69
70
71
72
73
74
75
76
77
78
79
80
81
82
83
84
85
86
87
88
89
90
91
92
93
94
95
96
97
98
99
100
101
102
103
104
105
106
107
108
109
110
111
112
113
114
115
116
117
118
119
120
121
122
123
124
125
126
127
128
129
130
131
132
133
134
135
136
137
138
139
140
141
142
143
144
145
146
147
148
149
150
151
152
153
154
155
156
157
158
159
160
161
162
163
164
165
166
167
168
169
170
171
172
173
174
175
176
177
178
179
180
181
182
183
184
185
186
187
188
189
190
191
192
193
194
195
196
197
198
199
200
201
202
203
204
205
206
207
208
209
210
211
212
213
214
215
216
217
218
219
220
221
222
223
224
225
226
227
228
229
230
231
232
233
234
235
236
237
238
239
240
241
242
243
244
245
246
247
248
249
250
251
252
253
254
255
256
257
258
259
260
261
262
263
264
265
266
267
268
269
270
271
using System;
using System.Collections.Generic;
using System.IO;
using System.Linq;
using System.Numerics;
using System.Security.Cryptography;
using System.Text;
using SixLabors.ImageSharp;
using SixLabors.ImageSharp.PixelFormats;
using SixLabors.ImageSharp.Processing;

namespace MyDemo;

public class BlogPostLowFrequencies
{
    public static Random Random = new();

    public static float Noise() => (float)Random.NextDouble() * 2 - 1;

    /// <summary>Adds a percentage of noise to an image.</summary>
    public static void NoiseImage(Image image, float amount)
    {
        image.Mutate(x =>
        {
            x.ProcessPixelRowsAsVector4(row =>
            {
                for (int i = 0; i < row.Length; i++)
                {
                    Vector4 vec = row[i];
                    vec.X = Math.Clamp(vec.X + Noise() * amount, 0, 1);
                    vec.Y = Math.Clamp(vec.Y + Noise() * amount, 0, 1);
                    vec.Z = Math.Clamp(vec.Z + Noise() * amount, 0, 1);
                    row[i] = vec;
                }
            });
        });
    }

    /// <summary>Creates a merge of several 300% noised images.</summary>
    public static Image CreateMergeImage(Image image, int steps, bool fancyMerge)
    {
        List<Image> mergables = [];
        for (int i = 0; i < steps; i++)
        {
            Image duplicate300m = image.Clone(_ => { });
            for (int j = 0; j < 3; j++)
            {
                NoiseImage(duplicate300m, 1);
            }
            mergables.Add(duplicate300m);
        }
        if (fancyMerge)
        {
            return MergeCleanly(mergables);
        }
        Image merged = mergables[0].Clone(_ => { });
        merged.Mutate(x =>
        {
            foreach (Image merge in mergables.Skip(1))
            {
                x.DrawImage(merge, 1f / steps);
            }
        });
        return merged;
    }

    /// <summary>Fancy RGB merge code that works a tiny bit better for large numbers of images than the opacity lazy trick.</summary>
    public static Image MergeCleanly(List<Image> mergables)
    {
        Image baseImg = new Image<RgbaVector>(mergables[0].Width, mergables[0].Height);
        float mult = 1f / mergables.Count;
        baseImg.Mutate(x =>
        {
            foreach (Image entry in mergables)
            {
                Image copy = new Image<RgbaVector>(baseImg.Width, baseImg.Height);
                copy.Mutate(y =>
                {
                    y.DrawImage(entry, PixelColorBlendingMode.Normal, 1);
                    y.ProcessPixelRowsAsVector4(row =>
                    {
                        for (int i = 0; i < row.Length; i++)
                        {
                            row[i].X *= mult;
                            row[i].Y *= mult;
                            row[i].Z *= mult;
                        }
                    });
                });
                x.DrawImage(copy, PixelColorBlendingMode.Add, 1);
            }
        });
        return baseImg;
    }

    /// <summary>Scale-shift based brightness/contrast fix.</summary>
    public static void FixContrast(Image image, float mul, float sub)
    {
        image.Mutate(x =>
        {
            x.ProcessPixelRowsAsVector4(row =>
            {
                for (int i = 0; i < row.Length; i++)
                {
                    Vector4 vec = row[i];
                    vec.X = Math.Clamp(vec.X * mul - sub, 0, 1);
                    vec.Y = Math.Clamp(vec.Y * mul - sub, 0, 1);
                    vec.Z = Math.Clamp(vec.Z * mul - sub, 0, 1);
                    row[i] = vec;
                }
            });
        });
    }

    /// <summary>Entry point for the noisy images demo section.</summary>
    public static void DoNoiseCollection(string imagePath)
    {
        //////////////////// Get the basic noised examples for the 2x2 grid
        Image input = Image.Load(imagePath);
        Image duplicate50 = input.Clone(_ => { });
        NoiseImage(duplicate50, 0.5f);
        duplicate50.Save(imagePath + ".noised50.png");
        Image duplicate100 = input.Clone(_ => { });
        NoiseImage(duplicate100, 1);
        duplicate100.Save(imagePath + ".noised100.png");
        Image duplicate300 = input.Clone(_ => { });
        for (int i = 0; i < 3; i++)
        {
            NoiseImage(duplicate300, 1);
        }
        duplicate300.Save(imagePath + ".noised300.png");
        //////////////////// Now the merging example
        Image merged = CreateMergeImage(input, 5, false);
        merged.Save(imagePath + ".merged.png");
        Image merged50 = CreateMergeImage(input, 50, true);
        merged50.Save(imagePath + ".merged50.png");
        //////////////////// Now the brightness-contrast fix to the merged images
        Image contrastFixed300 = duplicate300.Clone(_ => { });
        FixContrast(contrastFixed300, 5f, 2.5f);
        contrastFixed300.Save(imagePath + ".noised300.contrast.png");
        Image contrastFixedMerged = merged.Clone(_ => { });
        FixContrast(contrastFixedMerged, 5f, 2.5f);
        contrastFixedMerged.Save(imagePath + ".merged.contrast.png");
        Image contrastFixedMerged50 = merged50.Clone(_ => { });
        FixContrast(contrastFixedMerged50, 5, 2.5f);
        contrastFixedMerged50.Save(imagePath + ".merged50.contrast.png");
        Console.WriteLine("Done");
    }

    /// <summary>This is just to prove the coin flip counts idea, if you care. It creates every possible coin flip combination for 10 coins and sums them.</summary>
    public static void CoinFlipProof()
    {
        int totalFlips = 10;
        // true = heads, false = tails
        List<bool[]> allOptions = [];
        void AddAllCoinFlips(List<bool> prior, int remaining)
        {
            if (remaining == 0)
            {
                allOptions.Add([.. prior]);
                return;
            }
            List<bool> ifTrue = new(prior) { true };
            AddAllCoinFlips(ifTrue, remaining - 1);
            List<bool> ifFalse = new(prior) { false };
            AddAllCoinFlips(ifFalse, remaining - 1);
        }
        AddAllCoinFlips([], totalFlips);
        Console.WriteLine($"Total number of possible arrangements: 2^{totalFlips}, or {allOptions.Count}");
        for (int i = 0; i <= totalFlips; i++)
        {
            int counted = allOptions.Count(x => x.Count(y => y) == i);
            int renderable = counted * 20 / (totalFlips * totalFlips);
            Console.WriteLine($"The number of possible arrangements that have exactly {i:000} heads is: {counted:0000} ... {new string('=', renderable)}");
        }
    }

    public static byte[] AesEncrypt(Aes aes, byte[] bytes)
    {
        ICryptoTransform encryptor = aes.CreateEncryptor(aes.Key, aes.IV);
        using MemoryStream ms = new();
        using CryptoStream cs = new(ms, encryptor, CryptoStreamMode.Write);
        cs.Write(bytes, 0, bytes.Length);
        cs.Close();
        return ms.ToArray();
    }

    public static byte[] AesDecrypt(Aes aes, byte[] bytes)
    {
        ICryptoTransform decryptor = aes.CreateDecryptor(aes.Key, aes.IV);
        using MemoryStream ms = new();
        using CryptoStream cs = new(ms, decryptor, CryptoStreamMode.Write);
        cs.Write(bytes, 0, bytes.Length);
        cs.Close();
        return ms.ToArray();
    }

    public static byte[] ImageToBytesRaw(Image<Rgb24> image)
    {
        Image<Rgb24> img = image;
        byte[] bytes = new byte[img.Width * img.Height * 4];
        img.CopyPixelDataTo(bytes);
        return bytes;
    }

    public static void EncryptionDemo(string imagePath)
    {
        // Static seeded random for repeatability
        Random keyRandom = new(123);
        using Aes aesEcb = Aes.Create();
        byte[] keyBytes = new byte[256 / 8];
        keyRandom.NextBytes(keyBytes);
        byte[] ivBytes = new byte[128 / 8];
        keyRandom.NextBytes(ivBytes);
        aesEcb.Mode = CipherMode.ECB;
        aesEcb.Padding = PaddingMode.PKCS7;
        aesEcb.Key = keyBytes;
        aesEcb.IV = ivBytes;
        using Aes aesCbc = Aes.Create();
        aesCbc.Mode = CipherMode.CBC;
        aesCbc.Padding = PaddingMode.PKCS7;
        aesCbc.Key = keyBytes;
        aesCbc.IV = ivBytes;
        //////////////////////////////// Text encryption demo
        string exampleText = "This is some example text, written with common characters in English, and encoded as ASCII bytes.";
        void doEncryptDemo(string prefix, Aes aes)
        {
            byte[] textBytes = Encoding.ASCII.GetBytes(exampleText);
            byte[] encrypted = AesEncrypt(aes, textBytes);
            string encryptedText = new([.. Encoding.ASCII.GetString(encrypted).Select(c => c < 32 || c > 126 ? '?' : c)]);
            byte[] decrypted = AesDecrypt(aes, encrypted);
            string decryptedText = Encoding.ASCII.GetString(decrypted);
            Console.WriteLine($"Encryption demo {prefix}:\nOriginal : {exampleText}\nEncrypted: {encryptedText}\nDecrypted: {decryptedText}");
        }
        doEncryptDemo("ECB", aesEcb);
        doEncryptDemo("CBC", aesCbc);
        //////////////////////////////// Image encryption demo
        Image<Rgb24> input = Image.Load<Rgb24>(imagePath);
        byte[] rawBytes = ImageToBytesRaw(input);
        void doImageDemo(string prefix, Aes aes)
        {
            byte[] encryptedImageBytes = AesEncrypt(aes, rawBytes);
            Image encryptedImage = Image.LoadPixelData<Rgb24>(encryptedImageBytes, input.Width, input.Height);
            byte[] decryptedImageBytes = AesDecrypt(aes, encryptedImageBytes);
            Image decryptedImage = Image.LoadPixelData<Rgb24>(decryptedImageBytes, input.Width, input.Height);
            encryptedImage.Save($"{imagePath}.encrypted-{prefix}.png");
            decryptedImage.Save($"{imagePath}.decrypted-{prefix}.png");
        }
        doImageDemo("ECB", aesEcb);
        doImageDemo("CBC", aesCbc);
        void doMergedDemo()
        {
            List<Image> mergeMe = [];
            for (int i = 0; i < 100; i++)
            {
                keyRandom.NextBytes(ivBytes);
                using Aes aesMerged = Aes.Create();
                aesMerged.Mode = CipherMode.CBC;
                aesMerged.Padding = PaddingMode.PKCS7;
                aesMerged.Key = keyBytes;
                aesMerged.IV = ivBytes;
                byte[] encryptedImageBytes = AesEncrypt(aesMerged, rawBytes);
                Image encryptedImage = Image.LoadPixelData<Rgb24>(encryptedImageBytes, input.Width, input.Height);
                mergeMe.Add(encryptedImage);
            }
            Image merged = MergeCleanly(mergeMe);
            merged.Save($"{imagePath}.encrypted.merged.png");
        }
        doMergedDemo();
    }
}
And of course add a Program.cs with a public static void Main() entry point, and call any of these for the different demos:
BlogPostLowFrequencies.DoNoiseCollection(@"C:\your file path here\some image here.png");BlogPostLowFrequencies.EncryptionDemo(@"C:\your file path here\some image here.png");BlogPostLowFrequencies.CoinFlipProof();